One of the methods to study the X-ray emission is by analyzing the time variability of the source. The LAXPC software can be used to extract lag and RMS spectra, which can be used to study the time variability of the source. The syntax for extracting lag file is
laxpc_find_freqlag -h highest_frequency -l Minimum_Frequency -f expected_frequency -p pcu -u usergti.fits -e eneinput level2.events.fits
Here,
a) -h flag is for maximum Frequency for the power spectrum in Hz. The default value is 100 Hz.
b) -l flag is for minimum Frequency for the power spectrum in Hz. The default value is 1 Hz.
NOTE: For a power spectrum minimum frequency is also the frequency resultion. Since for FFT segemnts must be size of 2 the power multiples, the actual minimum frequency used may slightly differ from what is given.
c) -f flag is for frequency at which lags are to be computed in Hz. If not specified the lag will be computed at the frequency where the power is maximum.
d) -o flag is for root of output file name. The default name is level2.event
e) -e flag is the file containing energy ranges.
An example file is given. Default file name is ‘eneinput’. If file does not exist, default energy range chosen is two energy band 3-15 and 15-30 keV. Upto nine energy bands can be given. The first energy band given will be taken as the reference energy band. The energy bands should not overlap i.e. 3-15 and 10-30keV bands are not allowed. However, 3-15 and 15-20 are allowed i.e. the energy band need not be contigious.
f) -r flag is for PCU of the refernce energy band. If r is given as 1, then the reference energy bandwill be taken from PCU 10 and the other energy bands from 20 and 30. DO NOT USE UNLESS YOU ARE SURE WHAT THIS MEANS.
g) -d dead time in microseconds. Default is 42 microseconds.
Output:
All outputs are ascii files. Assuming that the root output file flag -o is set to outputfile.
a) File name:Lag_outputfile
File containing information for chosen frequency.
Contains Colums:
1 Mid Point Energy (keV)
2 Energy Range (keV)
3 Freq (Hz) at which lag is calculated should be same for all rows
4 Coherence
5 Coherence error
6 Time lag (secs)
7 Error on time lag
8 Intrinsic fractional r.ms.
9 error on Intrinsic fractional r.ms.
10 Intrinsic coherence (i.e. deadtime poisson fluction subtracted)
11 Intrinsic Coherence error
Here fractional r.m.s is square root of P(f)*df whereP(f) is deadtime Poisson level and background corrected power at the frequency where is lag is computed.
b) File name: "N"Pow_outputfile
For N = 1,2…
File containing information for a particiular energy band
For N = T
File containing information for a complete energy range
Contains Colums:
1 Mid Point Energy (keV) should be same for all rows
2 Energy Range (keV) should be same for all rows
3 Freq (Hz)
4 Coherence
5 Coherence error
6 Time lag (secs)
7 Error on time lag
8 Power
9 Error on Power
10 Intrinsic coherence (i.e.dead time poisson fluction subtracted)
11 Intrinsic Coherence error
12 Poisson noise level for Power spectrum (Deadtime corrected)
Power is deadtime Poisson level and background corrected.
c) File called “powfiles”, which list the rates at the energy bands and the list of Pow files generated. Used by rebin_pow_phamake_V1_Nov30.f
Power density spectra (PDS) is a widely used tool in astronomy to study the variability of X-ray sources. PDS can provide valuable information about the physical processes occurring in the source, such as the presence of a periodic or quasi-periodic Oscillations (QPO). The syntax for PDS extraction is
laxpc_rebin_power powfiles
It is often desired to rebin the power spectra in frequency and to create equivalent .pha files which allows the power spectra to be fitted using [XSPEC].
Requires:
Output:
If Pow files are of the form: NPow_outputfile then output files will be of the form:
reb_Pow_level2.event.pha"N where N = 1,2,3…
These are Xspec readable spectral files with response and Deadtime corrected Poisso level as the background.
$ laxpc_find_freqlag -l 0.05 -h 30 -p 1 -u usergti.fits -e eneinput level2.event.fits
 Event file being used: level2.event.fits
 PCUs being used: 1
 Output file post-root name: level2.event
 User GTI file name: usergti.fits
 Using Energy bins from file: eneinput
 No. of energy bins           1
 No. of user GTIs            1
 start time integer stop time percentage read
   0.0000000000000000        7832.5160998217762        100.000000     %
 Total no of segments =          458
 total no of points in lC=       469857
 time resultion (secs) =    1.6669999808073044E-002
 maximum frequency (Hz) =    29.994001545090427
 minimum frequency (Hz) =    5.8582034267754740E-002
 No of bins per segment =         1024
 User start and stop time
   2316.9299333244562        4836.6337443143129
 No of segments used          147
 Frequency used for Lag (Hz)    5.8582034267754740E-002
   1063.2439960977526       !Average count rate for all energies
 Total no of segments used =          147 of          147
 Average count rate and background rate
 For            1 lC =    1063.2439960977526        128.93691208515921
[[email protected] analysis]$ laxpc_rebin_power -l 0.01 -h 30.0 powfiles
  Name of file being used: powfiles
 1Pow_level2.event
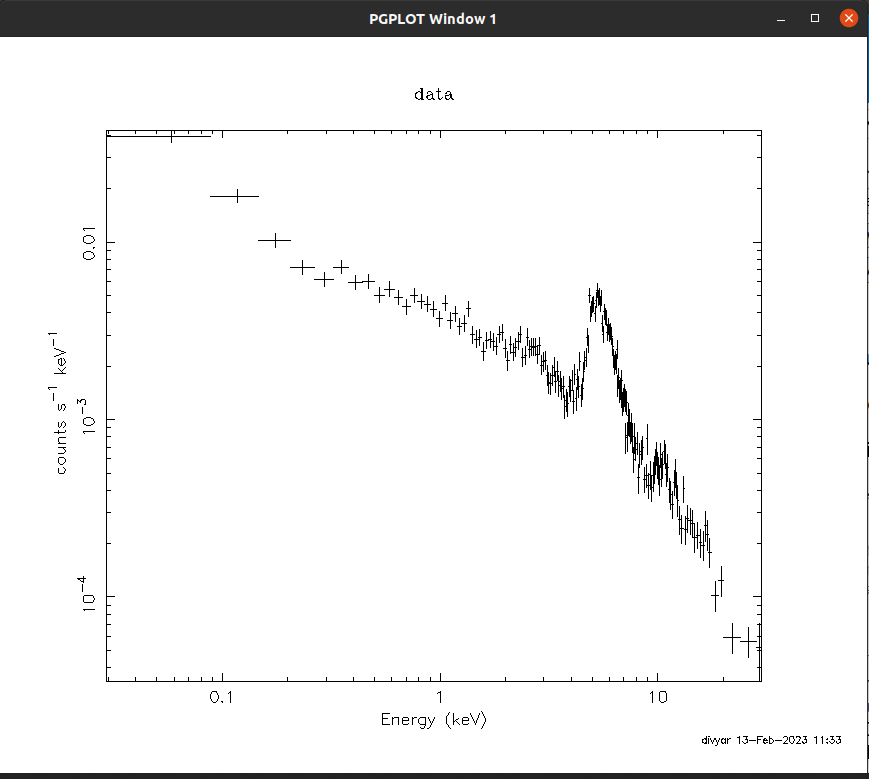
Once you have extracted the PDS, you can analyze it using [xspec].
$ xspec

       XSPEC version: 12.12.1
   Build Date/Time: Wed Mar 16 15:00:27 2022

XSPEC12>data reb_Pow_level2.event.pha1
Warning: RMF TELESCOPE keyword () is not consistent with spectrum (ASTROSAT)
Warning: RMF INSTRUMENT keyword () is not consistent with spectrum (LAXPC_Pow)
***Warning: Telescope name mismatch between spectrum and  background/correction files
Source: ASTROSAT Background/Correction
***Warning: Instrument name mismatch between spectrum and  background/correction files
Source: LAXPC_Pow Background/Correction

1 spectrum  in use

Spectral Data File: reb_Pow_level2.event.pha1  Spectrum 1
Net count rate (cts/s) for Spectrum:1  2.907e-02 +/- 4.345e-04 (30.3 % total)
Assigned to Data Group 1 and Plot Group 1
 Noticed Channels:  1-131
 Telescope: ASTROSAT Instrument: LAXPC_Pow  Channel Type: PI
 Exposure Time: 1 sec
Using fit statistic: chi
Using Background File                reb_backPow_level2.event.pha1
 Background Exposure Time: 1 sec
Using Response (RMF) File            reb_pha1Pow_level2.event.rsp for Source 1
The QPO is at ~5.4 Hz. Next we will extract RMS and lag spectra at QPO frequency.
3.0 5.0
5.0 7.0
7.0 10.0
10.0 12.0
20.0 30.0
$ laxpc_find_freqlag -l 0.054 -h 54 -f 5.4 -p 12 -u usergti.fits -e eneinput1 level2.event.fits
Event file being used: level2.event.fits
PCUs being used: 12
Output file post-root name: level2.event
User GTI file name: usergti.fits
Using Energy bins from file: eneinput1
No. of energy bins           5
No. of user GTIs            1
start time integer stop time percentage read
  0.0000000000000000        7832.5244713621214        100.000000     %
Total no of segments =          413
total no of points in lC=       845845
time resultion (secs) =    9.2599997296929359E-003
maximum frequency (Hz) =    53.995681921751000
minimum frequency (Hz) =    5.2730158126709961E-002
No of bins per segment =         2048
User start and stop time
  2316.9352723667398        4836.6274988148361
No of segments used          132
Frequency used for Lag (Hz)    5.3784761289244161
  2005.6930299567180       !Average count rate for all energies
Total no of segments used =          132 of          132
Average count rate and background rate
For            1 lC =    654.33572267045213        39.299219770912742
For            2 lC =    710.47376700154814        36.384349797527854
For            3 lC =    186.02680474939905        15.128732619795393
For            4 lC =    222.69623554668195        28.711590410354216
For            5 lC =    232.16049998863656        58.949967358450280
$ awk {'print $1, $2, $6, $7'} Lag_level2.event > lag_ene.txt
$ qdp lag_ene.txt
To produce plot, please enter
PGPLOT file/type: /xw
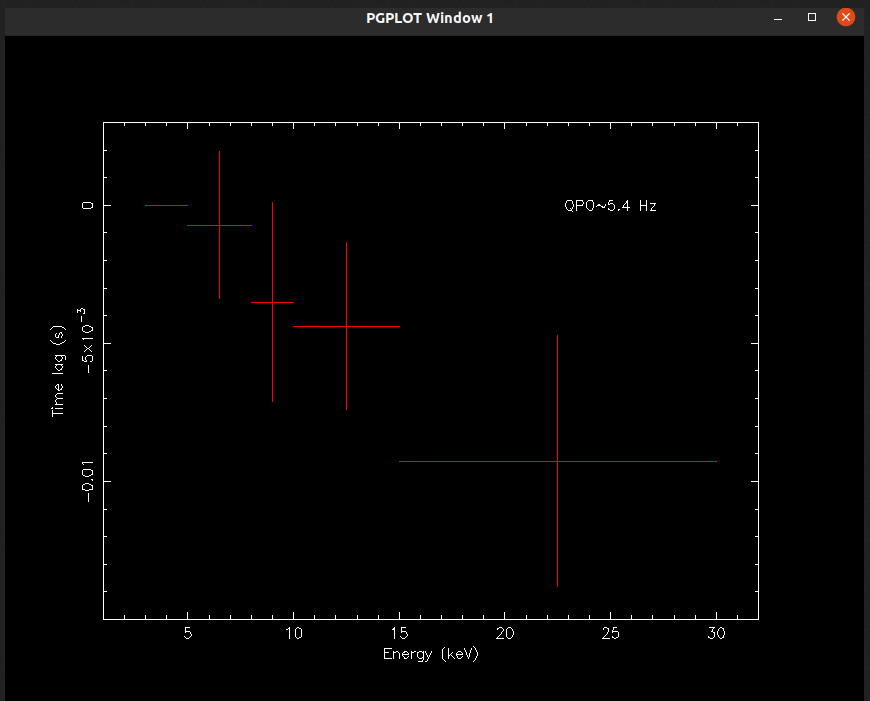
$ PLT > hardcopy lag_ene.ps/cps
$ PLT > exit
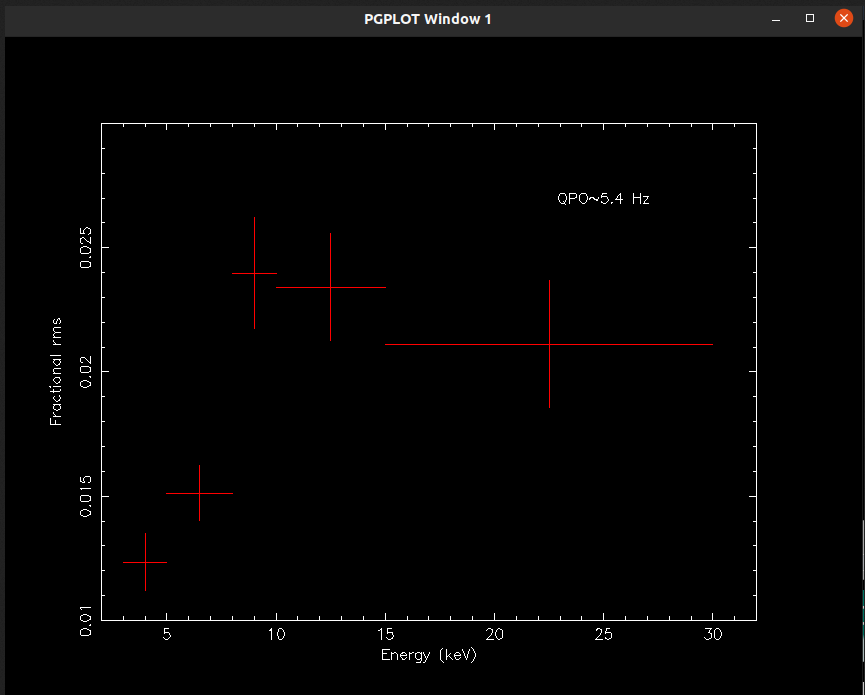
$ awk {'print $1, $2, $8, $9'} Lag_level2.event > rms_ene.txt
$ qdp rms_ene.txt
To produce plot, please enter
PGPLOT file/type: /xw
$ PLT> hardcopy rms_ene.ps/ps
$ PLT> quit