One important aspect of analyzing LAXPC data is the extraction of the background lightcurve. In this tutorial, we will discuss the steps involved in extracting the background lightcurve using LAXPC Sofware with syntax command:
laxpc_make_backlightcurve -p pcu -t timebin -u user_gti_file -e energy define file -l Layer no -s syserr filterfiles
Here,
-s flag is for systematic error added to the background lightcurve. The default value is 0.02.
NOTE: To run this command you MUST obtain source and background spectra first for the SAME usergti file and layer. RUN laxpc_make_spectra and laxpc_find_back with the same -u and -l flags BEFORE running this command.
Output:
If the output root file is the default value of ‘lightcurve’ the following files will be produced:
(a) Back_lightcurve.txt: Ascii text File containing counts/sec with time for the energy bands asked for. Useful for plotting and quick look.
(b) A series of Fits files of the form: Back_lightcurve_Emin_EmaxkeV.lc
where Emin and Emax are the energy range asked for.
e.x:
$ laxpc_make_backlightcurve -u usergti.fits filterfiles
 Filter file List being used: filterfiles
 GTI file List being used: usergti.fits
 Tstart  Tstop
   0.0000000000000000        2519.6771405339241
Output will be saved in Back_lightcurve_3.0_80.0keV.lc file.
$ lcmath
Name of input FITS file[lightcurve_3.0_50.0keV.lc] lightcurve_3.0_80.0keV.lc
Name of background FITS file[Back_lightcurve_3.0_50.0keV.lc] Back_lightcurve_3.0_80.0keV.lc
Name of output FITS file[Bkg_Sub_3.0_50.0keV.lc] Bkg_Sub_3.0_80.0keV.lc
Scaling factor for input[1.]
Scaling factor for background[1.]
Add instead of subract?[no]
WARNING:  Defaulting to first FITS extension
WARNING:  Defaulting to first FITS extension
Net or Sum light curve will be corrected
WARNING: Light curves possibly asynchronous! Check output.
100% completed
$ lcurve
lcurve 1.0 (xronos6.0)
Number of time series for this task[1]
Ser. 1 filename +options (or @file of filenames +options)[output_3.0_30.0keV.lc] Bkg_Sub_3.0_80.0keV.lc
Series 1 file 1:Bkg_Sub_3.0_80.0keV.lc
Selected FITS extensions: 1 - RATE TABLE;
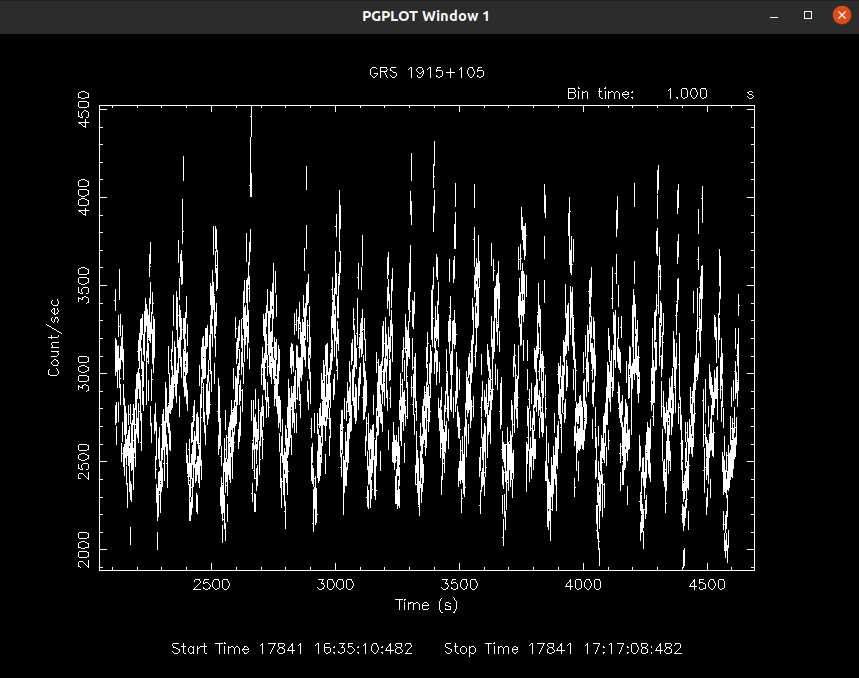
Source ............ GRS 1915+105 Start Time (d) .... 17841 15:56:33.482
FITS Extension .... 1 - `lightcurve` Stop Time (d) ..... 17841 17:17:08.482
No. of Rows ....... 2519 Bin Time (s) ...... 1.000
Right Ascension ... Internal time sys.. Converted to TJD
Declination ....... Experiment ........ ASTROSAT LAXPC3
Corrections applied: Vignetting - No ; Deadtime - No ; Bkgd - Yes; Clock - No
values: 1.00000000 1.00000000 1.00000000
Selected Columns: 1- Time; 2- Y-axis; 3- Y-error;
File contains binned data.
Name of the window file ('-' for default window)[-]
Expected Start ... 17841.66427641757 (days) 15:56:33:482 (h:m:s:ms)
Expected Stop .... 17841.72023706572 (days) 17:17: 8:482 (h:m:s:ms)
Minimum Newbin Time 1.0000000 (s)
for Maximum Newbin No.. 4835
Default Newbin Time is: 9.4544388 (s) (to have 1 Intv. of 512 Newbins)
Type INDEF to accept the default value
Newbin Time or negative rebinning[1]
Newbin Time ...... 1.0000000 (s)
Maximum Newbin No. 4835
Default Newbins per Interval are: 512
(giving 10 Intervals of 512 Newbins each)
Type INDEF to accept the default value
Number of Newbins/Interval[4835]
Maximum of 1 Intvs. with 4835 Newbins of 1.00000 (s)
Name of output file[-]
Do you want to plot your results?[yes]
Enter PGPLOT device[/xw]
4835 analysis results per interval
100% completed
Intv 1 Start 17841 16:35:10
Ser.1 Avg 2879. Chisq 0.1117E+06 Var 0.1529E+06 Newbs. 2519
Min 1944. Max 4462. expVar 3448. Bins 2519
PLT> exit
Writing output file: -.flc