In addition to the primary sources observed within FOV, CZTI also detects off-axis transients such as Gamma Ray Bursts (GRB) (see for example Rao et al, 2016). In this example, we generate the CZTI light curve of a GRB, GRB160821A. This GRB occurred during the observation ID 9000000618, so first download the level-1 zip file for this observation ID from AstroBrowse.
We start from level-1 data as we would use the generalized event selection algorithm for the analysis instead of the default one. The default event selection algorithm is optimized for on-axis sources and is not best suited for GRBs, instead a generalized event selection algorithm is employed. Please see Ratheesh et al (2021) for more details.
Unzip the level-1 zip file LEVEL1AS1CZT20160821G05_009T02_9000000618.zip to desired location to get level-1 directory 20160821_G05_009T02_9000000618_level1. Also create a level-2 directory 20160821_G05_009T02_9000000618_level2 where the output files will be generated.
Now execute cztpipline with inputs as below. Note that evtselalgo='generalized' is given as a commandline optio to cztpipeline and the mkfthresholdfile is given to be the threshold file specific to transients which excludes the conditions of earth occultation of the primary source etc. Also, note that we use mask-weight = No option as the light curve for GRB, which is an off-axis source cannot be generated by mask-weighting.
$ cztpipeline evtselalgo='generalized' mkfthresholdfile='${as1czt}/config/mkfThresholds_transients.txt'

--------------------------------------------------------------------------------------------------
                                ASTROSAT CZTI PIPELINE
                                Version: V3.0 December 2022
--------------------------------------------------------------------------------------------------
Enter Start Step [2]: 1
Enter End Step [3]: 3
Enter L1 Directory Path []: /home/user/path/data_czti/20160821_G05_009T02_9000000618_level1
Enter path to create L2 pipeline products []:
/home/user/path/data_czti/20160821_G05_009T02_9000000618_level2
Enter full path of user-gtifile [-]:
Enter output type <lc/spec/both>(for cztbindata) [spec]: lc
Apply maskweights (YES/NO)(for cztbindata) [Yes]: No
Enter time bin size for lc (for cztbindata) [100]: 1
Enter minimum energy for lc (keV) (for cztbindata) [20]: 20
Enter maximum energy for lc (keV) (for cztbindata) [200]: 200
Overwrite existing file?(YES/NO): [YES]:
--------------------------------------------------------------------------------------------------
                                        CZTPIPELINE PARAMETERS
--------------------------------------------------------------------------------------------------
Task Name                   : cztpipeline.py
Level1 Directory            : /home/user/path/data_czti/20160821_G05_009T02_9000000618_level1
Level2 Directory            : /home/user/path/data_czti/20160821_G05_009T02_9000000618_level2
Entry Stage                 : 1
Exit Stage                  : 3
Right Ascension of Source   : 0.0
Declination of Source       : 0.0
User GTI File               : -
Event Selection Algorithm   : generalized
Clobber                     : YES
--------------------------------------------------------------------------------------------------
Generalized mode selected.
CZTBUNCHCLEAN will be executed with skipT1, skipT2, and skipT3 set to zero.
CZTDATASEL will be executed with gtitype = QUAD

--------------------------------------------------------------------------------------------------

Do you want to continue? [Y/n]: Y
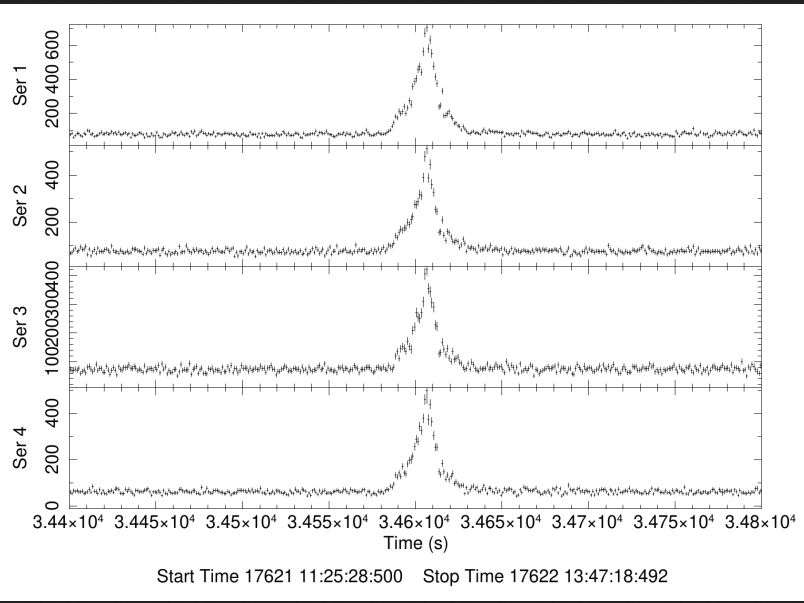
This generates the light curves for each quadrant for the entire observation. It may also be noted that the pipeline also generates images, but has no meaning in this case. Figure 3 shows the light curves loaded in lcurve showing the time around the GRB.
|
|---|
| Figure 3: CZTI light curve for GRB. Four panels show the light curves of each quadrant. |